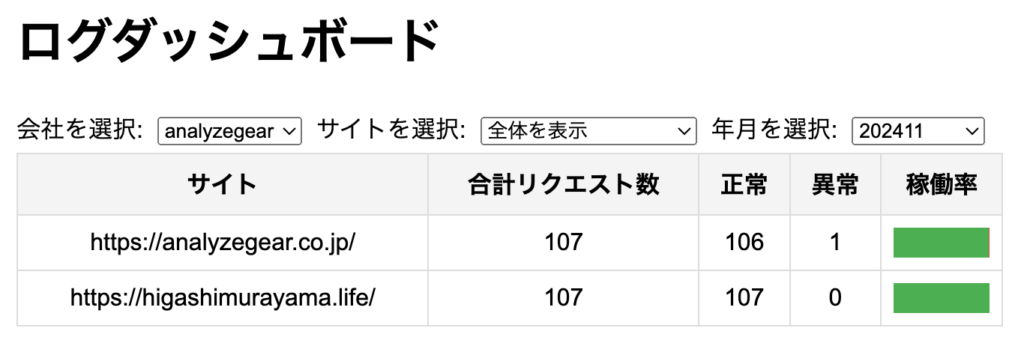
本記事では、これまで作成した死活監視スクリプトで取得したログを活用し、過去の監視データを集計・可視化する方法をご紹介します。Flaskを使用したログデータの保存・集計システムと、そのデータを可視化するダッシュボードの構築手順を解説します。
以下の画像は完成したダッシュボードの例です:

使用技術
以下の技術を使用して実装しました:
- Python / Flask: WebアプリケーションとAPIの構築。
- HTML/CSS/JavaScript: ダッシュボードのフロントエンド構築。
- CSV: ログデータの保存形式。
- CGI: FlaskアプリをCGIスクリプトとして実行。
ファイル構成
プロジェクトのディレクトリ構造は以下の通りです:
/site_monitor/
│
├── logs/
│   ├── analyzegear/
│   │   ├── site1/
│   │   │   ├── monitor_results_202411.csv
│   │   │   ├── monitor_results_202410.csv
│   │   │   ...
│   │   ├── site2/
│   │       ├── monitor_results_202411.csv
│   │       ├── monitor_results_202410.csv
│   ...
├── app/
│   ├── main.py        # Flaskアプリケーション
│   ├── templates/
│   │   └── index.html # ダッシュボードHTML
│   ├── static/
│       ├── styles.css # カスタムCSS
│       ├── script.js  # カスタムJavaScript
│
├── .htaccess          # Apache設定ファイル
├── index.cgi          # FlaskアプリをCGI経由で実行
コード一覧
1. .htaccess
Options +ExecCGI
AddHandler cgi-script .cgi
DirectoryIndex index.cgi

# すべてのリクエストを index.cgi にリダイレクト
RewriteEngine On
RewriteCond %{REQUEST_FILENAME} !-f
RewriteCond %{REQUEST_FILENAME} !-d
RewriteRule ^(.*)$ /index.cgi/$1 [QSA,L]
2. index.cgi
#!/home/youruser/miniconda3/envs/flask_env/bin/python

from main import app
import os

# CGI ハンドラー
def cgi_handler():

    from wsgiref.handlers import CGIHandler

    # Flask アプリケーションをCGI経由で実行
    CGIHandler().run(app)

if __name__ == '__main__':
    # デバッグ用コードを削除
    cgi_handler()
3. Flaskアプリ (main.py)
from flask import Flask, jsonify, render_template
import os
import csv
from collections import defaultdict
from datetime import datetime

app = Flask(__name__)

# ログ保存ベースディレクトリ
LOG_DIR = "./logs"

def parse_logs(company=None, site=None, year_month=None):
    """
    ログを会社、サイト、年月で絞り込んで集計する
    """
    data = defaultdict(lambda: {"total": 0, "success": 0, "failure": 0, "status_codes": defaultdict(int)})
    companies = [company] if company else os.listdir(LOG_DIR)

    for comp in companies:
        company_dir = os.path.join(LOG_DIR, comp)
        if not os.path.isdir(company_dir):
            continue

        site_dirs = [site] if site else os.listdir(company_dir)
        for site_dir in site_dirs:
            site_path = os.path.join(company_dir, site_dir)
            if not os.path.isdir(site_path):
                continue

            for log_file in os.listdir(site_path):
                if log_file.endswith(".csv"):
                    file_date = log_file.split("_")[-1].replace(".csv", "")
                    if year_month and not file_date.startswith(year_month):
                        continue

                    with open(os.path.join(site_path, log_file), mode="r") as f:
                        reader = csv.DictReader(f)
                        for row in reader:
                            site_url = row["サイト"]
                            status = row["状態"]
                            status_code = row["ステータスコード"]

                            data[site_url]["total"] += 1
                            if status == "正常に稼働中":
                                data[site_url]["success"] += 1
                            else:
                                data[site_url]["failure"] += 1
                            data[site_url]["status_codes"][status_code] += 1

    return {"logs": data}

def get_site_list(company):
    """
    会社内のすべてのサイトを取得
    """
    sites = []
    company_dir = os.path.join(LOG_DIR, company)
    if not os.path.isdir(company_dir):
        return sites

    for site_dir in os.listdir(company_dir):
        site_path = os.path.join(company_dir, site_dir)
        if os.path.isdir(site_path):
            sites.append(site_dir)

    return sites

def get_year_month_list():
    """
    ログディレクトリから年月を動的に取得
    """
    year_months = set()
    for company_dir in os.listdir(LOG_DIR):
        company_path = os.path.join(LOG_DIR, company_dir)
        if not os.path.isdir(company_path):
            continue

        for site_dir in os.listdir(company_path):
            site_path = os.path.join(company_path, site_dir)
            if not os.path.isdir(site_path):
                continue

            for log_file in os.listdir(site_path):
                if log_file.endswith(".csv"):
                    file_date = log_file.split("_")[-1].replace(".csv", "")
                    year_months.add(file_date[:6])

    return sorted(year_months)

@app.route("/")
def index():
    year_months = get_year_month_list()
    all_data = parse_logs()
    companies = os.listdir(LOG_DIR)
    return render_template("index.html", companies=companies, initial_logs=all_data["logs"], year_months=year_months)

@app.route("/api/all")
def api_all():
    logs = parse_logs()
    return jsonify(logs)

@app.route("/api/<company>")
def api_company(company):
    logs = parse_logs(company)
    sites = get_site_list(company)
    return jsonify({"logs": logs["logs"], "sites": sites})

@app.route("/api/<company>/<site>")
def api_company_site(company, site):
    logs = parse_logs(company, site)
    return jsonify(logs)

@app.route("/api/<company>/<site>/<year_month>")
def api_company_site_year_month(company, site, year_month):
    logs = parse_logs(company, site, year_month)
    return jsonify(logs)

@app.route("/api/<company>/<year_month>")
def api_company_year_month(company, year_month):
    logs = parse_logs(company=company, year_month=year_month)
    return jsonify(logs)

if __name__ == "__main__":
    app.run(debug=True)
4. HTML (index.html)
<!DOCTYPE html>
<html lang="ja">
<head>
    <meta charset="UTF-8">
    <meta name="viewport" content="width=device-width, initial-scale=1.0">
    <title>ログダッシュボード</title>
    <script src="https://cdn.jsdelivr.net/npm/chart.js"></script>
    <link rel="stylesheet" href="/static/styles.css">
</head>
<body>
    <h1>ログダッシュボード</h1>
    <form id="selection-form">
        <label for="company">会社を選択:</label>
        <select id="company">
            <option value="all" selected>全体を表示</option>
            {% for company in companies %}
            <option value="{{ company }}">{{ company }}</option>
            {% endfor %}
        </select>

        <label for="site">サイトを選択:</label>
        <select id="site" disabled>
            <option value="all" selected>全体を表示</option>
        </select>

        <label for="year_month">年月を選択:</label>
        <select id="year_month">
            <option value="all" selected>全体を表示</option>
            {% for year_month in year_months %}
            <option value="{{ year_month }}">{{ year_month }}</option>
            {% endfor %}
        </select>
    </form>

    <div id="logs-container"></div>

    <script src="/static/script.js"></script>
</body>
</html>
5. CSS (styles.css)
body {
    font-family: Arial, sans-serif;
    margin: 20px;
}
table {
    width: 100%;
    border-collapse: collapse;
    margin-bottom: 20px;
}
th, td {
    border: 1px solid #ddd;
    padding: 8px;
    text-align: center;
}
th {
    background-color: #f4f4f4;
}
select, button {
    margin: 5px;
}
.bar-chart {
    height: 20px;
    display: flex;
}
.bar-success {
    background-color: #4caf50;
}
.bar-failure {
    background-color: #f44336;
}
6. JavaScript (script.js)
const companySelect = document.getElementById("company");
const siteSelect = document.getElementById("site");
const yearMonthSelect = document.getElementById("year_month");
const logsContainer = document.getElementById("logs-container");

async function fetchData(url) {
    const response = await fetch(url);
    if (!response.ok) {
        console.error("データの取得に失敗しました:", response.status);
        return null;
    }
    return await response.json();
}

async function initialize() {
    const allData = await fetchData("/api/all");
    if (allData) {
        renderLogs(allData.logs);
    }
}

function renderLogs(logs) {
    logsContainer.innerHTML = `
        <table>
            <thead>
                <tr>
                    <th>サイト</th>
                    <th>合計リクエスト数</th>
                    <th>正常</th>
                    <th>異常</th>
                    <th>稼働率</th>
                </tr>
            </thead>
            <tbody>
                ${Object.entries(logs).map(([site, data]) => {
                    const successRate = (data.success / data.total) * 100 || 0;
                    return `
                        <tr>
                            <td>${site}</td>
                            <td>${data.total}</td>
                            <td>${data.success}</td>
                            <td>${data.failure}</td>
                            <td>
                                <div class="bar-chart">
                                    <div class="bar-success" style="width: ${successRate}%"></div>
                                    <div class="bar-failure" style="width: ${100 - successRate}%"></div>
                                </div>
                            </td>
                        </tr>`;
                }).join("")}
            </tbody>
        </table>
    `;
}

companySelect.addEventListener("change", async () => {
    const company = companySelect.value;
    if (company === "all") {
        siteSelect.disabled = true;
        yearMonthSelect.disabled = false;
        initialize();
        return;
    }
    const data = await fetchData(`/api/${company}`);
    if (data) {
        renderLogs(data.logs);
        siteSelect.innerHTML = '<option value="all" selected>全体を表示</option>';
        data.sites.forEach(site => {
            siteSelect.innerHTML += `<option value="${site}">${site}</option>`;
        });
        siteSelect.disabled = false;
    }
});

siteSelect.addEventListener("change", async () => {
    const company = companySelect.value;
    const site = siteSelect.value;
    const yearMonth = yearMonthSelect.value;
    const url = site === "all"
        ? `/api/${company}/${yearMonth}`
        : `/api/${company}/${site}/${yearMonth}`;
    const data = await fetchData(url);
    if (data) renderLogs(data.logs);
});

yearMonthSelect.addEventListener("change", async () => {
    const company = companySelect.value;
    const site = siteSelect.value;
    const yearMonth = yearMonthSelect.value;
    const url = site === "all"
        ? `/api/${company}/${yearMonth}`
        : `/api/${company}/${site}/${yearMonth}`;
    const data = await fetchData(url);
    if (data) renderLogs(data.logs);
});

initialize();
APIレスポンス例
/api/all
{
    "https://example.com/": {
        "total": 100,
        "success": 98,
        "failure": 2,
        "status_codes": {
            "200": 98,
            "500": 2
        }
    },
    "https://analyzegear.co.jp/": {
        "total": 120,
        "success": 115,
        "failure": 5,
        "status_codes": {
            "200": 115,
            "404": 5
        }
    }
}
まとめ
このプロジェクトでは、監視データを効率的に集計・表示できるダッシュボードをFlaskと簡単なHTML/CSS/JavaScriptで構築しました。サーバーの稼働状況をリアルタイムで把握でき、異常検知の迅速な対応に役立ちます。監視システムの改良や、さらに詳細なグラフや通知機能を追加することで、運用の効率化を図ることが可能です。


コメント